Computer Vision - Experiment 2 - Histogram of images
Experimental objectives and requirements
(i) To master the method of drawing histogram of image through experiment;
(ii) To master the method of image histogram equalization through the experiment.
Experiment content
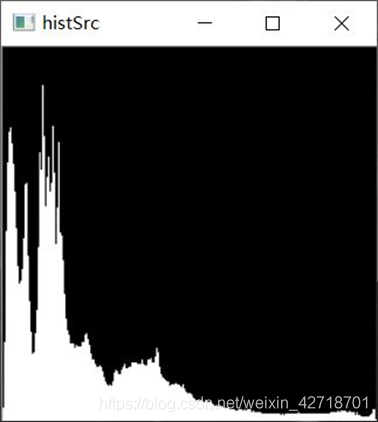
(i) Use the calcHist function in OpenCV to calculate the histogram, and after the calculation, use the rectangle function in OpenCV to draw rectangles to complete the histogram drawing.
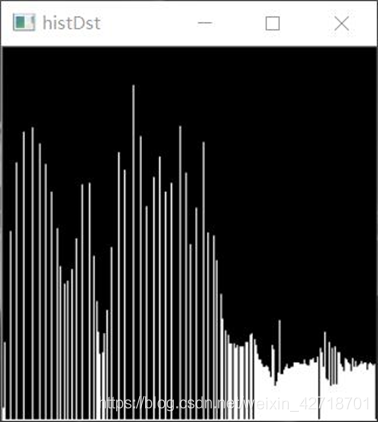
(ii) the histogram equalization function in OpenCV is used to implement the histogram equalization function.
Experimental instruments, equipment
A computer with Windows 7 operating system and Visual Studio 2015 installed
Experimental principle
(i) The calculation of the histogram can be done in OpenCV using the calcHist function, and after the calculation is done, it can be done using the drawing functions in OpenCV, such as the rectangle function for drawing rectangles.
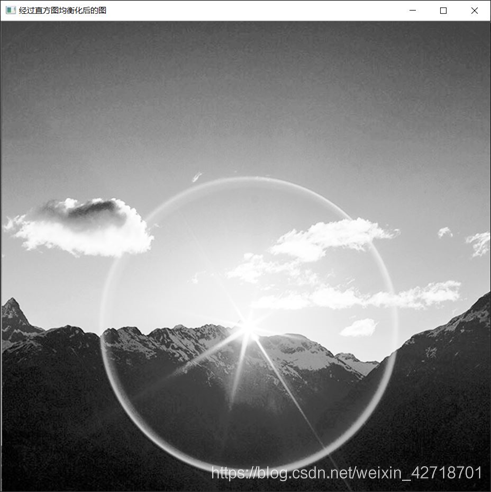
(ii) Many times, the results of photos taken with a camera are often unsatisfactory. This is when some processing can be done on these images to expand the dynamic range of the image. The most commonly used technique in this case is histogram equalization. The equalized image has a more expansive spectrum, effectively using the 0-255 space, and a more expressive image; in OpenCV, the functional implementation of histogram equalization is done by the equalizeHist function.
Experimental steps
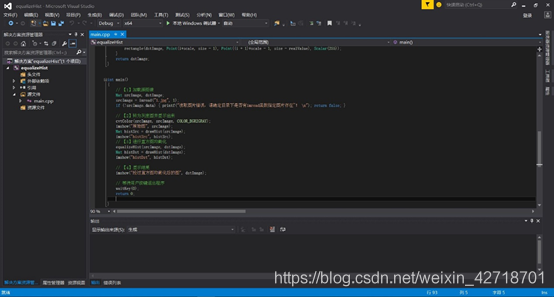
(i) Create the Visual Studio 2015 console program;
(ii) Configure OpenCV in Visual Studio 2015;
(iii) Write code to plot the image histogram using the calcHist function and rectangle;
(iv) Write code to complete histogram equalization using equalizeHist function.
Experimental notes
(i) Configure OpenCV in VS after completing the installation of OpenCV;
(ii) The functions and usage of calcHist and equalizeHist functions.
Experimental results
(i) Experimental code
 1
 2
 3
 4
 5
 6
 7
 8
 9
10
11
12
13
14
15
16
17
18
19
20
21
22
23
24
25
26
27
28
29
30
31
32
33
34
35
36
37
38
39
40
41
42
43
44
45
46
47
48
49
50
51
52
53
54
55
56
57
58
59
60
61
62
63
64
65
66
67
68
69
|
//------------------------------【头文件、命名空间包含部分】---------------------------
//          描述:包含程序所使用的头文件和命名空间
//-------------------------------------------------------------------------------------
#include "opencv2/highgui/highgui.hpp"
#include "opencv2/imgproc/imgproc.hpp"
using namespace cv;
//-----------------------------------【main( )函数】-------------------------------------
//          描述:控制台应用程序的入口函数,我们的程序从这里开始执行
//-------------------------------------------------------------------------------------
Mat drawHist(Mat srcImage)
{
	//【2】定义变量
	MatND dstHist;       // 在cv中用CvHistogram *hist = cvCreateHist
	int dims = 1;
	float hranges[] = { 0, 255 };
	const float *ranges[] = { hranges };   // 这里需要为const类型
	int size = 256; //设定bin数目,必须和灰度级数目相等,这里是0到255,所以size为256
	int channels = 0;
	//【3】计算图像的直方图
	//void calcHist(const Mat* images, int nimages,
	//	const int* channels, InputArray mask,
	//	OutputArray hist, int dims, const int* histSize,
	//	const float** ranges, bool uniform = true, bool accumulate = false)
	//参数1表示需要用来计算直方图的源图像序列,因此可以允许有多张大小一样,数据类型相同的图像被用来统计其直方图特征。
	//参数2表示的就是使用多少张图像序列中的图像用于计算直方图。
	//参数3的出现主要是考虑到输入的每一张图像有可能是多通道的,比如说RGB图就是3通道的,那么从统计意义上来讲,一张RGB图其实就是3张单通道的图像,而计算直方图时其本质也是针对单张图像进行的。这里虽然我们输入的图像序列images中有很多图片,但是并不是每一张图片的每一个通道都会被用来计算。所以参数3的功能是指定哪些通道的图像被用来计算(后面的解释都假设图像序列中图像是3通道的,那么有的图像可能有多个通道都被用来计算,有的图像可能连一个通道都没有被采用),这时参数3里面保存的是通道的序号,那么图像序列images中的第一张图片的通道序号(假设图像时3通道的)为0, 1, 2;images中第二张图片的图像序列接着上一次的,为3, 4, 5, ;依次类推即可。
	//参数4是mask掩膜操作,即指定每张图片的哪些像素被用于计算直方图,这个掩膜矩阵不能够针对特定图像设定特定的掩膜,因此在这里是一视同仁对待的。
	//参数5是保存计算的直方图结果的矩阵,有可能是多维矩阵。
	//参数6是需要计算的直方图的维数。
	//参数7是所需计算直方图的每一维的大小,即每一维bin的个数。
	calcHist(&srcImage, 1, &channels, Mat(), dstHist, dims, &size, ranges);    // cv 中是cvCalcHist
	int scale = 1;
	Mat dstImage(size * scale, size, CV_8U, Scalar(0));
	//【4】获取最大值和最小值
	double minValue = 0;
	double maxValue = 0;
	minMaxLoc(dstHist, &minValue, &maxValue, 0, 0);  //  在cv中用的是cvGetMinMaxHistValue
	//【5】绘制出直方图
	//saturate_cast<int>(double v)           { return cvRound(v); }
	int hpt = saturate_cast<int>(0.9 * size);//防止溢出,hpt=230
	for (int i = 0; i < 256; i++)
	{
		float binValue = dstHist.at<float>(i);           //   注意hist中是float类型    而在OpenCV1.0版中用cvQueryHistValue_1D
		int realValue = saturate_cast<int>(binValue * hpt / maxValue);
		rectangle(dstImage, Point(i*scale, size - 1), Point((i + 1)*scale - 1, size - realValue), Scalar(255));
	}
	return dstImage;
}
int main()
{
	// 【1】加载源图像
	Mat srcImage, dstImage;
	srcImage = imread("1.jpg", 1);
	if (!srcImage.data) { printf("读取图片错误,请确定目录下是否有imread函数指定图片存在~! \n"); return false; }
	// 【2】转为灰度图并显示出来
	cvtColor(srcImage, srcImage, COLOR_BGR2GRAY);
	imshow("原始图", srcImage);
	Mat histSrc = drawHist(srcImage);
	imshow("histSrc", histSrc);
	// 【3】进行直方图均衡化
	equalizeHist(srcImage, dstImage);
	Mat histDst = drawHist(dstImage);
	imshow("histDst", histDst);
	// 【4】显示结果
	imshow("经过直方图均衡化后的图", dstImage);
	// 等待用户按键退出程序
	waitKey(0);
	return 0;
}
|
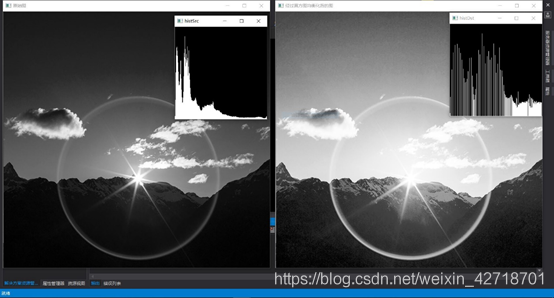
(ii) Show results

Experiment summary
The main content of this experiment is to master the histogram method of drawing images and the image histogram equalization method. I used the calcHist function in OpenCV to calculate the histogram, and then used the rectangle function in OpenCV to draw a rectangle to complete the histogram; in OpenCV, I used the equalizeHist function to achieve the histogram equalization function. By writing the code, I learned to use the calcHist function and rectangle to draw the image histogram; I learned to use the equalizeHist function to complete the histogram equalization.